COVID-19 has had an unprecedented impact on the global economy in recent months.
The international shipping industry is responsible for the carriage of approximately 90% of global trade. In an ever more connected world, countries are increasingly dependent on international trade to power their economies. It is therefore inevitable that a global pandemic will affect the way vessels are operating and these operational changes cause a shift in the risk profiles of individual vessels.
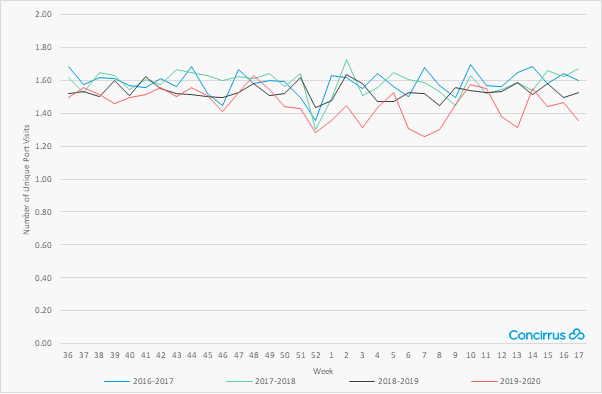
Vessel mileage and the number of unique port visits can provide insight into vessel utilisation and variations in trading geography respectively. At an aggregate level, these metrics also become useful features for assessing more general shipping activity to help us understand how COVID-19 has influenced risk profiles across insurance portfolios.
Containerships
Global average weekly distances covered by large containerships saw a notable decline at the beginning of March this year. Distances dropped from 1,857 to 1,675 (-9.8%) nautical miles compared to the same time in 2019.

Figure 1. Containership Average Weekly Distance - Global
We’ve also seen a reduction of 17-18% in containership unique weekly port visits in Asia and Europe during February and March as the movement of cargo slowed.

Figure 2. Containership Average Unique Port Visits - Asia

Figure 3. Containership Average Unique Port Visits - Europe
Whilst the reduction in berthing operations may initially lead to a reduction in claims we could see a rise in claims in the future as port activity increases and the industry tries to clear a backlog of goods.
Bulk carriers
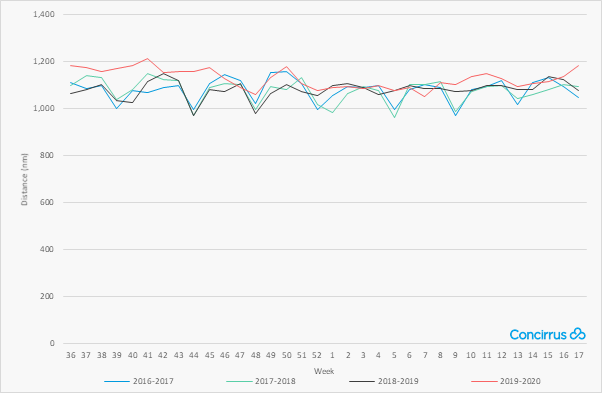
Bulk carriers have continued to operate with a weekly mileage average of approximately 1,100 nautical miles indicating limited change in operational profiles (Figure 4).

Figure 4. Bulk Carrier Average Weekly Distance - Global
Cruise ships
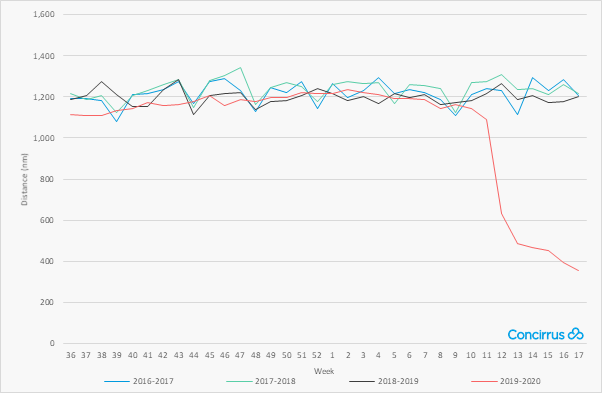
The cruise industry has been one of the hardest hit sectors of the global pandemic as a direct result of social distancing measures.
At the end of April average weekly distance sailed had reduced by 70.5% compared to the previous year with many vessels remaining in port.

Figure 5. Cruise Ship Average Weekly Distance - Global
For a more detailed overview of the data and links to deeper insights into specific sectors click here.
