Since its launch, the major claims database has grown in size and improved its data. We now have data from 27 countries, all of whom are members of IUMI. Everyone’s input is most welcome
and adds to the integrity of the database.
During the Chicago annual conference, I was pleased to present the cargo large loss data once again. In addition, as an example of further innovation, I was also able to launch the hull statistics now
that we have sufficient confidence in the quality of the dataset.
It is worth reminding everyone of the project’s mission, namely, to create an extensive and consistent database of hull and cargo losses. This will enable all markets and their underwriters to
benchmark and study the severity, frequency, location and cause of major hull and cargo losses. Those with access to data on the world fleet size can begin an objective analysis of their book.
We have also received tremendous support from Boston Consulting Group (BCG) and facilitation from the IUMI secretariat to advance the project to this mature stage.
This year, we welcomed Taiwan and Thailand to our list of contributors; next year, we truly believe we can breach 30 countries. We originally started with six.
We now have 11,000 claims records in the database, which equate to USD 17.3 billion in value. Breaking this figure down further, we have for Hull – 7,100 observations up by 29% (valued at
USD 10.4 billion) and for Cargo – 3,900 observations up by 17% (valued at USD 6.9 billion).
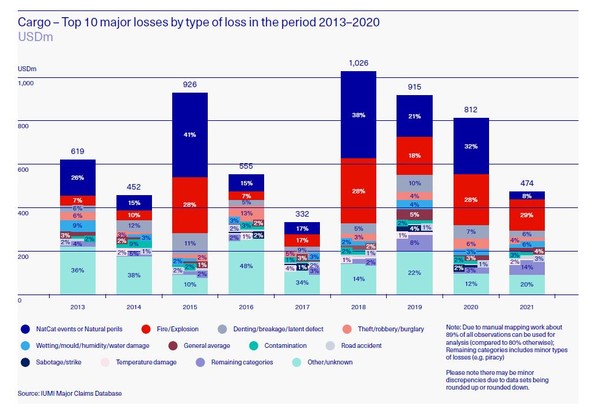
For both Hull and Cargo, we can now demonstrate the incurred loss and average loss per year based on known loss development. In 2021, there were 346 cargo observations at a value of USD 495 million. The average large cargo loss is 1.4m. We also look at loss buckets with an expected distribution, for example, for 2021, the majority of large losses were under USD 500,000, and this
represented the highest number since we started the project. Does this show a rise in attritional losses? We will know more over time.
We seek to compare the volume and value of large losses. Of the 3,900 cargo claims at USD 6.9 billion value, only 2% are over USD 10 million, but that 2% is 37% of value. This is both understandable and now proven. The major losses by type (volume and value-based) are also studied, with Nat Cat both included and excluded for comparison. Fire/Explosion is consistently high, which itself connects to IUMI’s public policy work on container fires.
All the charts presented in Chicago are available via IUMI channels at the aggregate level. If anyone needs them for a single year, this can also be requested.
It was heartening to be able to finally reveal the hull statistics. This class represents the majority of the data and can now be studied. As it is a more extensive dataset, there is potential for duplications. However, on further analysis, this is far less than feared, which gave us the confidence to publish.
By way of an example for 2021 – we saw USD 1.2 billion value made up of 764 hull observations and an average loss of USD 1.6 million. The loss buckets saw a slight fall in volume of losses under
USD 500,000 but a rise in the USD 2.5–5 million range.
In closing, we are always happy to receive feedback from the IUMI Hull and Cargo community to improve the database. Every year, the database grows, as does the insured value. We are in active
discussions with other markets for them to join the project. When they do, IUMI will have an irresistible repository of market trend analysis which all marine practitioners will be able to harvest to suit their own needs.
I look forward to meeting you all in Edinburgh.
